Operational visibility
Raft uses NLP and OCR models to automatically process unstructured emails, PDFs and invoices—extracting key shipment fields and triggering downstream API workflows. I designed the Visibility Hub as a unified control panel that consolidates these multi-source data streams into a single interface, letting freight forwarders track and manage active shipments without context-switching.
- Role
- Product Designer
- Industry
- Logistics & Supply Chain
- Disciplines
- Product Design · User Research · AI Workflow
- Deliverables
- Research synthesis · IA & data model · User flows · High-fidelity prototype
Context & strategic challenge
Freight forwarding operations are severely bottlenecked by data fragmentation. Operators communicate with 10 to 25 separate entities per shipment, spending hours manually copying data from unstructured emails and PDFs into legacy Transportation Management Systems (TMS). They spend most of their workday gathering data rather than analyzing operational risk.
The goal
Design an AI-driven Visibility Hub within Raft to programmatically consolidate multi-platform data, surface real-time shipment alerts and transition operators from manual data entry to proactive exception management.
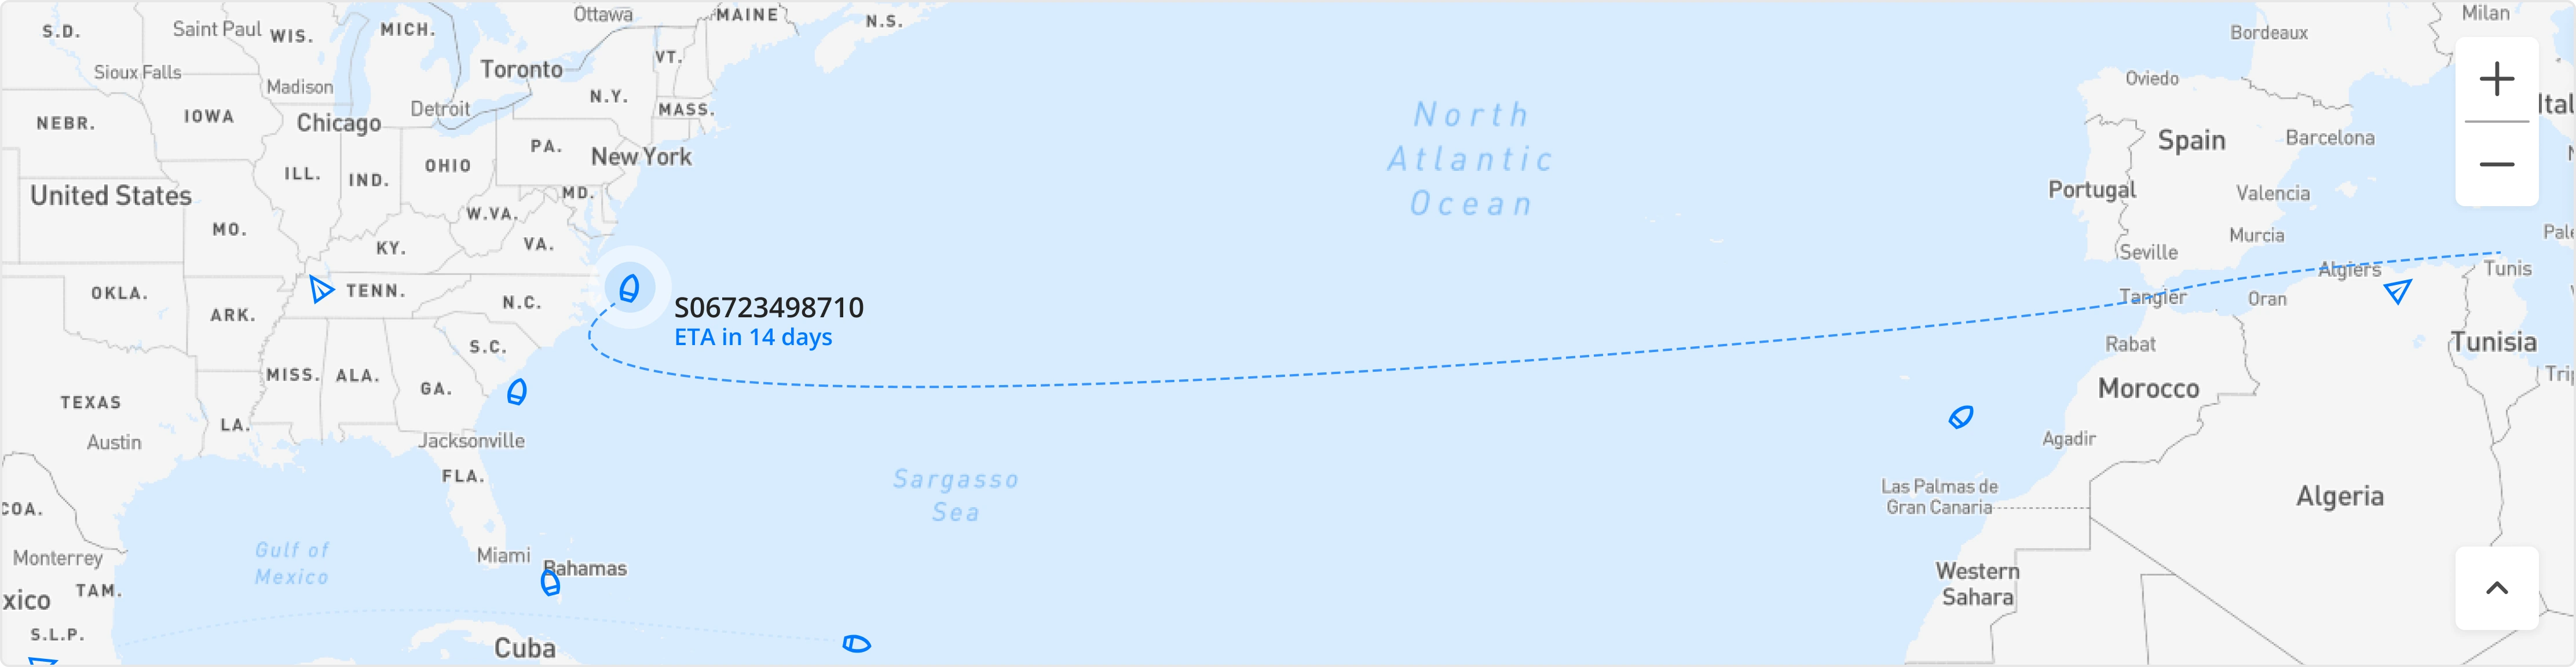
Defining visibility, then earning trust in it
We ran interviews with operators, target user groups and ocean freight specialists to establish what visibility means in practice and where the current tooling was failing them. A modular interview framework let a single guide serve very different profiles, from operations staff to customs and finance leads. The same pain points came back across every profile: chasing status updates by email, re-keying the same shipment data into multiple systems, and finding out about delays and missing documents too late to act on them.
What we learned
Visibility means seeing detailed information about every process in a supply chain, in real time. Operators already had that information, spread across a dozen tools and inboxes, and many were deeply attached to the way they worked. Currency was the deciding factor: information that might be an hour old was treated as unverified.
Key insight
If operators don't trust the source, they open the original PDF and re-verify it by hand, which cancels out the value of extracting it automatically. Trust had to be designed in: every item in the feed carries its provenance — email forwarding, customs form, user upload — so a claim can be checked in place rather than re-sourced.
Design architecture & UI execution
Designing for high-density logistics meant turning several unrelated data streams into one structure an operator could scan. Three decisions carried the design.
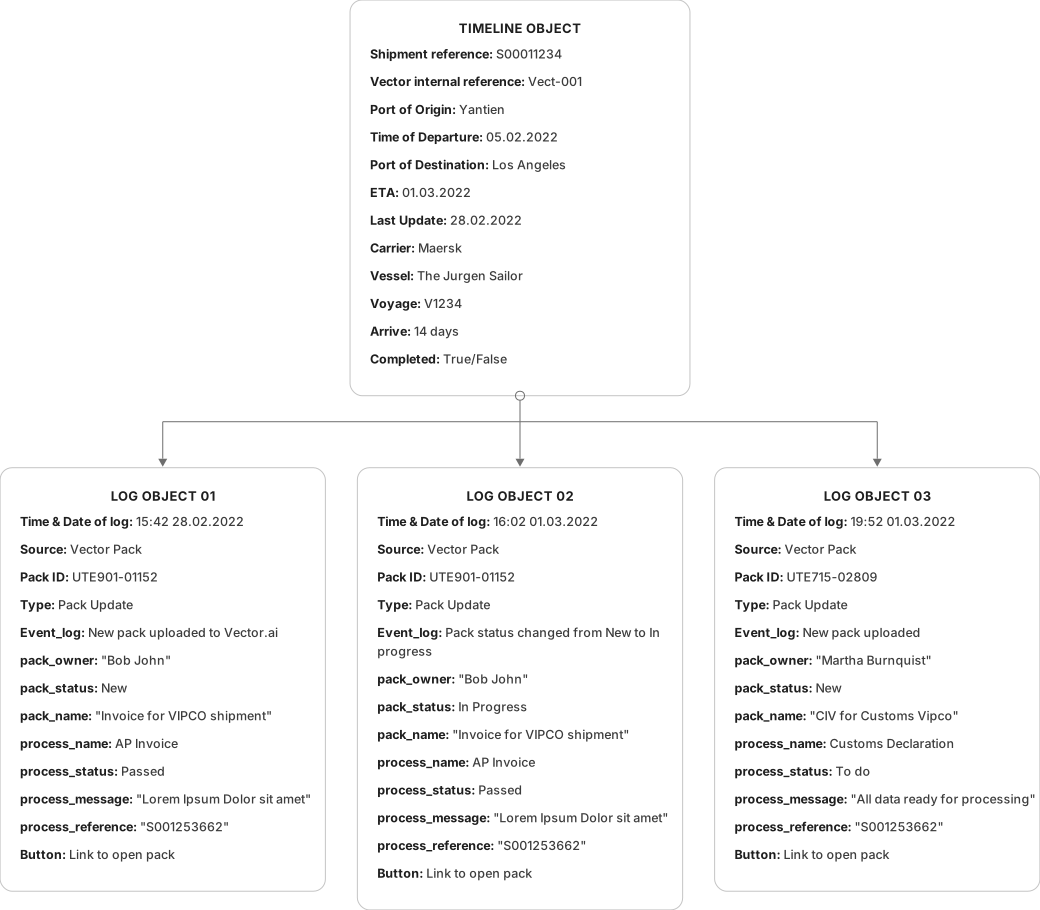
One shipment, one timeline
A shipment is a single timeline object carrying reference, route, carrier, vessel and ETA. Everything that happens to it arrives as a log entry with its own timestamp, source and status. Because the model is append-only, the feed is a record rather than a rendering, and nothing overwrites what an operator saw yesterday.
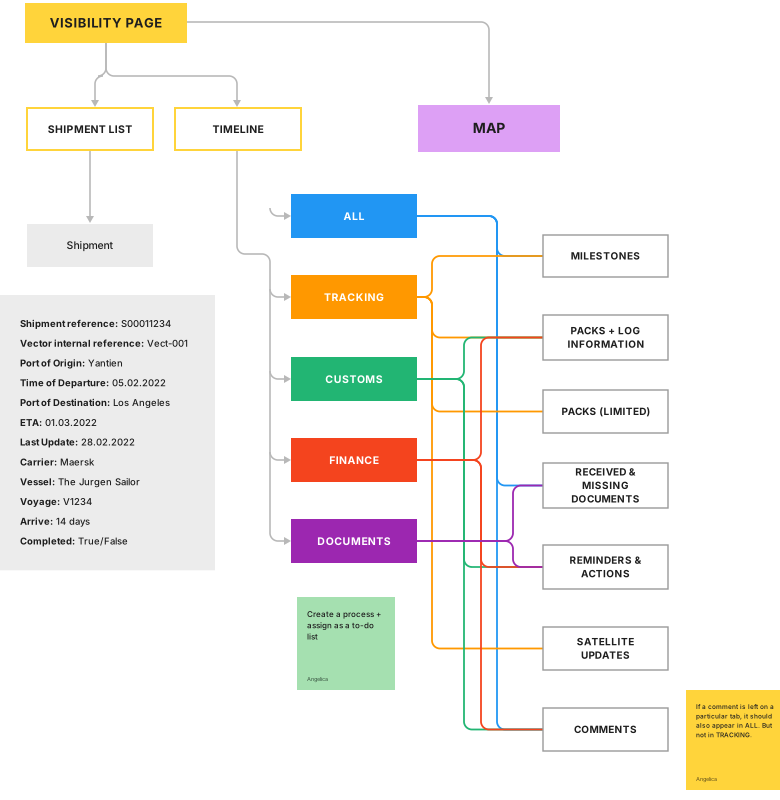
Five views onto the same feed
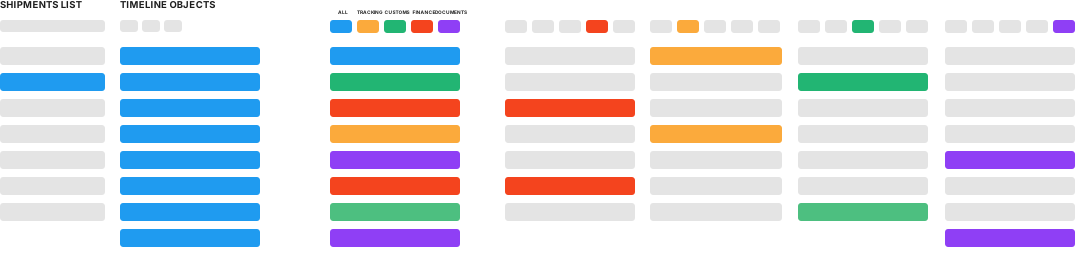
Rather than separate screens per function, the timeline filters into All, Tracking, Customs, Finance and Documents. Each filter shows a defined subset — milestones, packs and log information, received and missing documents, reminders and actions, satellite updates, comments — so operators move between concerns without losing their place in the shipment.
Exceptions over tables
The shipment list leads with what is wrong rather than what exists: failed pre-alerts, overdue arrival notices, customs to-dos. Operators can create a process and assign it as a to-do directly from the feed, which is what moved the daily job from data entry towards exception management.
Impact & outcomes
Weeks from brief to working MVP
Question groups structuring the research
Timeline views onto a single shipment feed
Entities per shipment consolidated into one view
The MVP was designed and shipped inside a two-week design sprint and piloted with operators at Scarbrough Group to validate workflow speed and parsing accuracy. The work also surfaced integration partners who could feed real-time tracking data into the platform, and the log-object pattern became the template for how later data sources were brought in.